System Memory Analysis
Specifics - System Storage (Memory) Analysis:
This is a deeper dive into memory information. These details can be used to better determine memory issues.
The memory subsystem analysis should be done top down:
- z/VM - how the overall system is configured/running.
- Virtual machines - how users/servers are configured/running.
- VDISK/MDC/Address spaces - how the system processes are configured/running.
- Linux servers/processes - how the Linux servers are configured/running.
Helpful ESAMON screens/ESAMAP reports:
- ESAMDC - Extended Minidisk Cache Analysis - Shows information about minidisk cache activity and effectiveness.
- ESAVDSK - VDISK Analysis - Shows VDISK paging activity.
- ESADCSS - NSS/DCSS Analysis - Shows NSS/DCSS paging activity.
- ESAFREE - Free Storage Analysis - Shows free memory analysis information.
- ESAME - Memory Extension Analysis - Shows free list replenishment and contention for frames.
- ESAASPC - Shared Address Space Analysis - Shows configuration, utilization and paging activity for shared address
spaces.
ESAMDC - Shows minidisk cache activity.
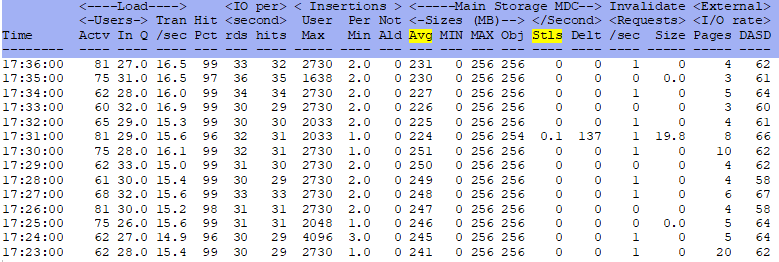
Avg - This shows the average minidisk caching memory. Watch for large changes.
Stls - This shows page steals. This is when the memory subsystem takes pages from MDC. If this number
grows, it would indicate a memory issue.
ESAVDSK - Shows VDISK paging activity.
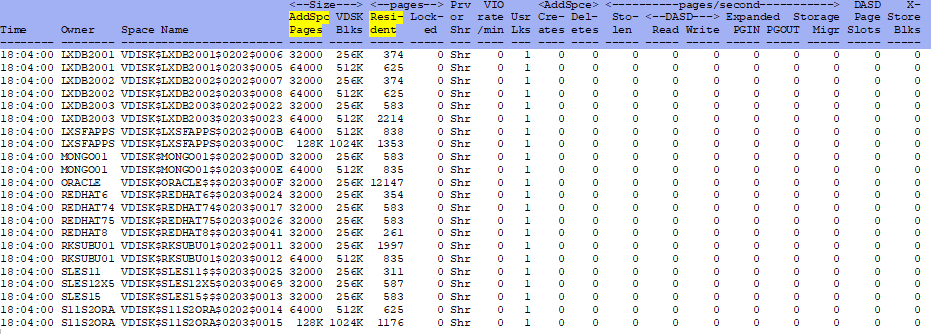
AddSpc Pages - This shows the average virtual disk space in pages that have been allocated. There should be
two disks for swapping. One small and one large, prioritized to use the small until it fills up. If the larger one
starts being used, there is a memory issue. Be sure to prioritize correctly!
See VDISK Analysis for more information.
Resident - This shows the number of address space pages that are resident. Watch the resident pages
for large changes.
ESADCSS - Shows NSS/DCSS paging activity.
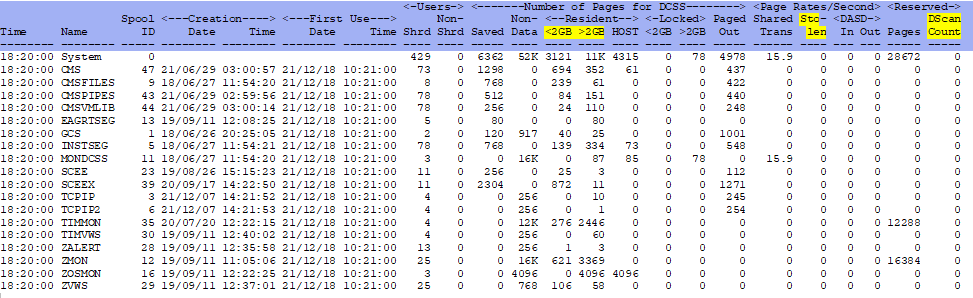
<2GB >2GB - This shows how many pages are in memory for DCSS/NSS segments.
Page Rates/Second/Stolen - This shows the number of pages stolen from an NSS/DCSS. This is a problem.
Reserved DScan Count - This shows the number of times a demand scan could not move frames. This could also
indicate an issue.
ESAFREE - Shows free memory analysis information.
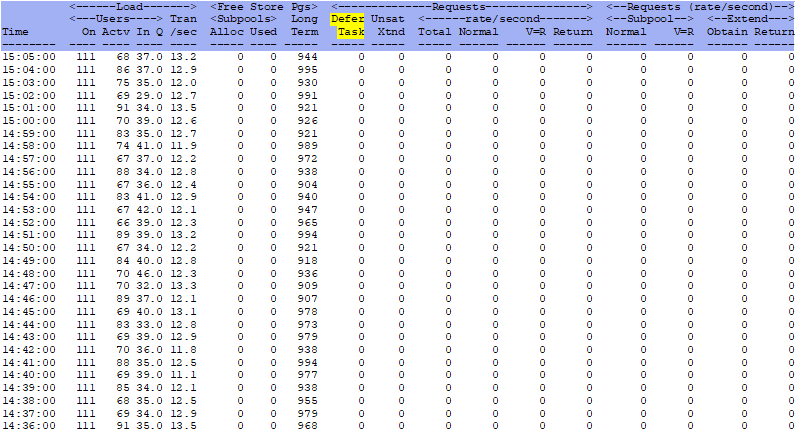
Requests - Defer Task - This shows the number of unsatisfied free memory requests. If there are more than two
requests deferred, the memory available is insufficient.
ESAME - Shows memory extension analysis information - free list replenishment and contention for frames.
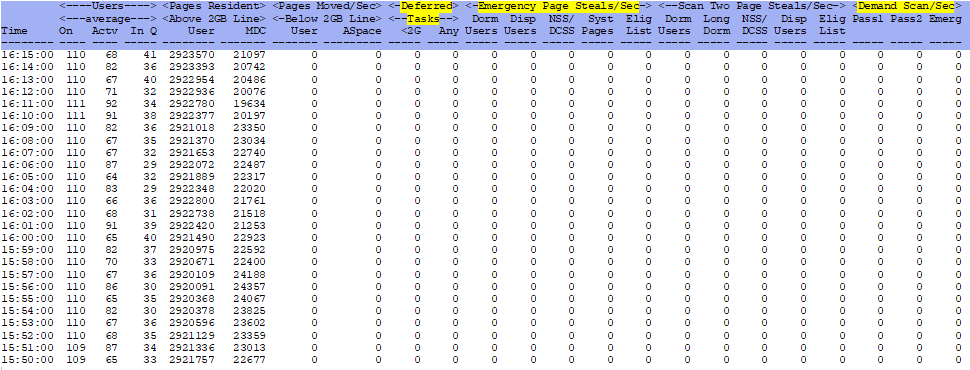
Deferred Tasks - This shows CP deferred tasks waiting for a page frame. This indicates a memory shortage.
Emergency Page Steals/Sec - These show the number of pages harvested in an emergency pass. This also indicates
a memory shortage. If pages are harvested from NSS/DCSS's, this will impact monitor applications severely.
Demand Scan/Sec - This shows the evolution of demands - a first pass, a second pass, then an emergency pass.
The numbers should usually be 0. If they show more than 2, then there is a severe memory shortage.
ESAASPC - Shared Address Space Analysis - Shows configuration, utilization and paging activity for
shared address spaces
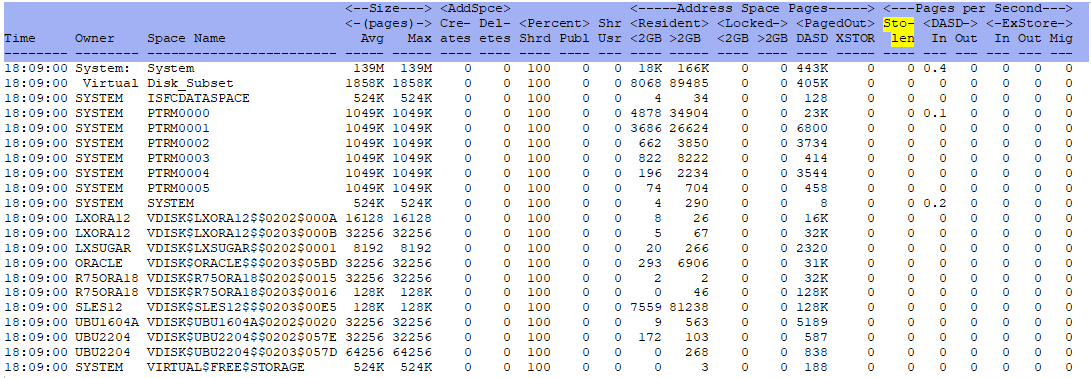
Pages per Second Stolen - This shows the number of pages stolen from the address space. This also indicates
a memory shortage.
Back to top of page
Back to Flow Chart main page

