Channel Analysis
Specifics - Channel Analysis:
There have been many upgrades to channels over the years. From Escon to Ficon to the new z/17 architecture, each upgrade
has improved the performance of transfering data. I/O Processors (IOP) have been added for managing I/O operations and
processing I/O data, thus giving more processing power back to the CPU and allowing for additional ports on the I/O
adapters. System Assist Processors (SAP) have been around for a some time, while Data Processing Units (DPU) are new
to the z17. Both (now) on the new Telum II chip, the SAP is a processor core(s) and the DPU is a low-latency silicon-level
accelerator engine(s) - usually there are mutliple of both. Currently the Ficon Express adapter running in FICON mode is
the only adapter expected to heavily use the SAP. SAPs share workload, acting as one giant processor, DPUs do not.
To determine channel issues, the following four components need to be reviewed (if it isn't any of these, it is most likely
an external network problem):
- System Assist Processors (SAP) - ESAIOP - Pct Util Busy
- Data Processing Units (DPU) - ESACHAN - DPU Util Pct
- I/O Adapters - ESACHAN - Data Units Read/Pct, Write/Pct
- Peripheral Component Interconnect Express (PCIe) - ESACHAN - Bus Cy Pct
The z17 introduced many changes to the channel environment. The following presentation covering these changes:
Introduction to z17 Channel Performance Management
Helpful ESAMON screens/ESAMAP reports:
- ESACHAN - Channel Performance Analysis - shows how the current channels are performing.
- ESACHNH - HiperSocket Channel Report - shows how the utilization of HiperSocket channels.
- ESAIOP - I/O Processor Analysis - shows information about the I/O processing units.
ESACHAN - Shows the channel performance

Pct Channel Utilization - This shows the channel utilization for the LPAR and all the LPARS to which
it is connected. If the channel utilization is over 30%, consider faster channels or moving data.
If the total utilization for all of the connected LPARS is over 40%, consider adding channels, moving to faster
channels or moving data to other channels. Alerts should be set for these percentages.
Data Unit Pct/Work Unit Pct - This shows the percent busy for the channel. This should
really stay under 40%. Again, alerts can be set for these. Also watch for an imbalance between reads and writes - this
can indicate a bottleneck. If an external hardware component has a lower read or write limit, it will autonegotiate to
the lower level. The Total Reads and Writes per second shows the total for the CEC so only one LPAR on each CEC needs
to provide the information.
Bus Cy - This shows the PCIe utilization. This usually isn't an issue. The PCIe has half of its utilization
moving one way and half moving the other way. If either direction is oversaturated it will show has high (over 50%)
utilization, which could mean there is an overload.
DPU Util Pct - This shows statistics for the new Data Processing Units (DPUs). Only the new FICON Express
32-4P and Network Express adapters will show DPU data because they are the only adapters which use the DPU. Further I/O
adapter releases are also expected to utilize the DPU. Like the SAPs, smaller I/O block sizes will impact
performance. Heavy use of non-zHPF operations on a FICON Express 32-4P card will also impact DPU performance and will
show up as high DPU utilization. Watch for any single overutilized DPU as they are not shared like SAPs.
DPU Num - This shows the DPU number. Each channel's sent/received data is processed by a single DPU (DPU's
do not share workload like SAPs)
Note: This report can be used to verify issues such as mixing ESCON and FICON channels or a channel
being overworked. Also, for DPUs, channel utilization per DPU and DPU utilization per channel can both be seen.
The DPUs are managed automatically via PR/SM and are new so more testing will be done to see how the metrics can be used
to spot potential problems.
ESACHNH - Shows the HiperSocket channel performance
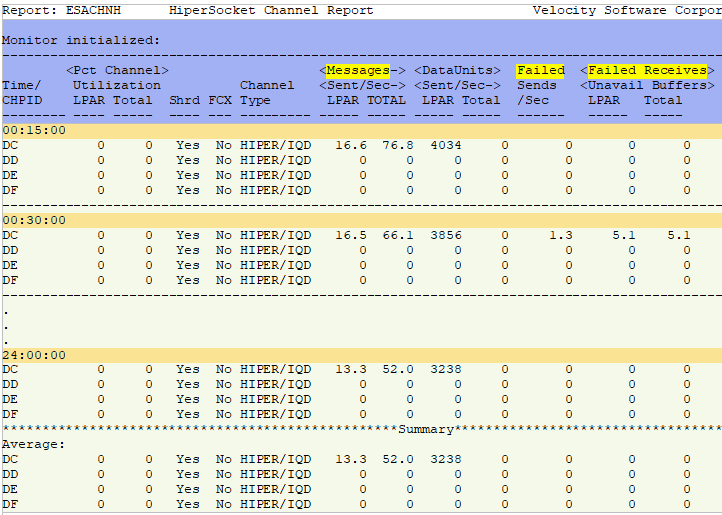
Channel Type - This shows the type of channel.
Messages Sent/Sec LPAR/TOTAL - This shows the number of messages sent per second on this path (LPAR) and on
this path for all LPARs (TOTAL). This can be viewed to track message volume trends.
DataUnits Sent/Sec LPAR/Total - This shows the number of data units sent per second on this path (LPAR) and on
this path for all LPARs (Total). This can be viewed to track message volume trends.
Failed Send/Sec - This shows unsuccessful attempts to send messages. Watch for errors.
Failed Receives Unavail Buffers LPAR/Total - This shows the number of times transmissions failed due to
unavailable receive buffers for this LPAR (LPAR) and for all LPARs (Total). Watch for errors.
ESAIOP - Shows the I/O processor unit performance
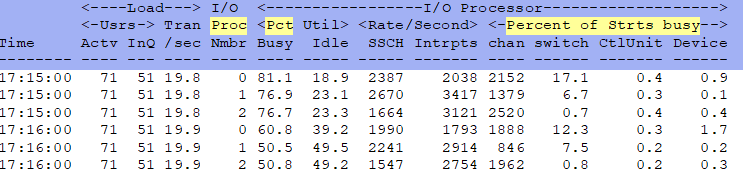
I/O Proc Nmbr - This shows the processor number (and how many SAPs there are). Since SAPs share the workload,
if the SAPs are overutilized, high utilization will be seen across all SAPs.
I/O Processor Pct Busy - This shows the I/O processor utilization. If high, it may indicate a problem,
especially if there is high Pend time from ESADSD2.
Percent of Strts busy - This shows the percentage of SSCH busy time in each step of the process.
Note: Small block sizes and a large number of FICON Express adapters in Ficon mode will add to high SAP
utilization.
Back to top of page
Back to Flow Chart main page

